feat. trees, tractors, and phones
We have developed a machine learning solution that can identify and quantify flower clusters from photos. This idea came from a Polish farmer’s need for apple yield estimation. The ability to estimate the yield for the upcoming season can help farmers plan their harvesting and marketing strategies.
Watch a video with a visualization of flower cluster segmentation. The model for segmentation is described below.
Together with the farmer, we received financial support from Test Farms by EIT Food. This program helped us develop and test a technical solution for apple yield estimation. Specifically, we aimed to develop an easy-to-use technology that would be accessible through a mobile app without the need to purchase an expensive device.
Fieldwork and data collection
Model training and results
Challenges and further plans
Fieldwork and data collection
We came.
We made our fieldwork experiment and data collection in an apple orchard in Kleczanówin the Sandomierz region, Poland. Poland has the largest apple production in Europe and 4th in the world. For this reason, we traveled to the second-largest apple area in Poland and collected our data precisely at the time the apple trees were in the fool bloom at the beginning of May.
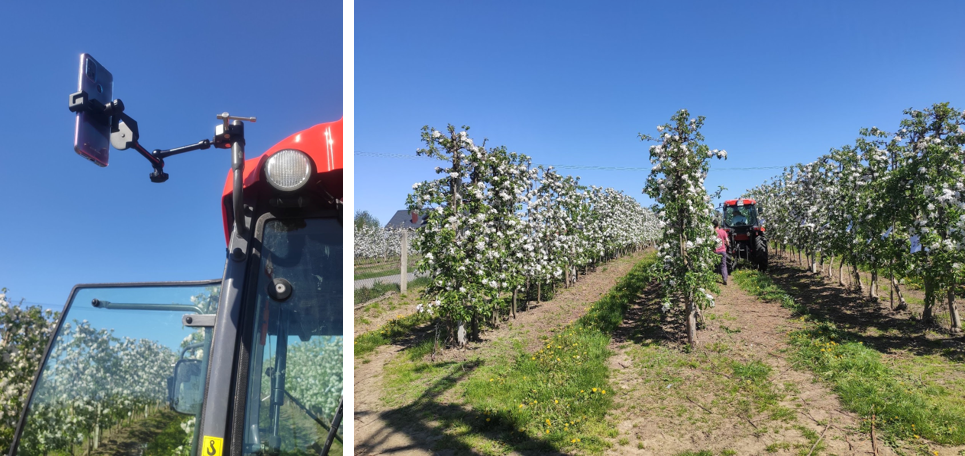
For data collection, we used 2 Motorola G30 mobile phones mounted to the tractor by simple holders – both had cameras pointing to one side, one at the front and one at the back of the tractor. Further, we used the OpenCamera application to take the pictures. Then we cruised between the rows of the wall-typed apple orchard and tested different settings of the camera to optimize the process of data collection. After finding the most suitable one, we scanned several rows, in which we later calculated the yield.
Model training and results
We calculated.
Machine learning segmentation model
First, we annotated the photos acquired during our scanning. In each picture, we tagged clusters of flowers, each representing one apple. Next, we used this data for model training. We gradually tried three different models – a simple convolution model, EfficientNetV2 trained for the plant classification, and ResNet50. Interestingly, the simple convolution model achieved the best performance. The convolution model segments the area with flower clusters and assigns a score to each photo. The score indicates a percentual area of the flower clusters in the image.
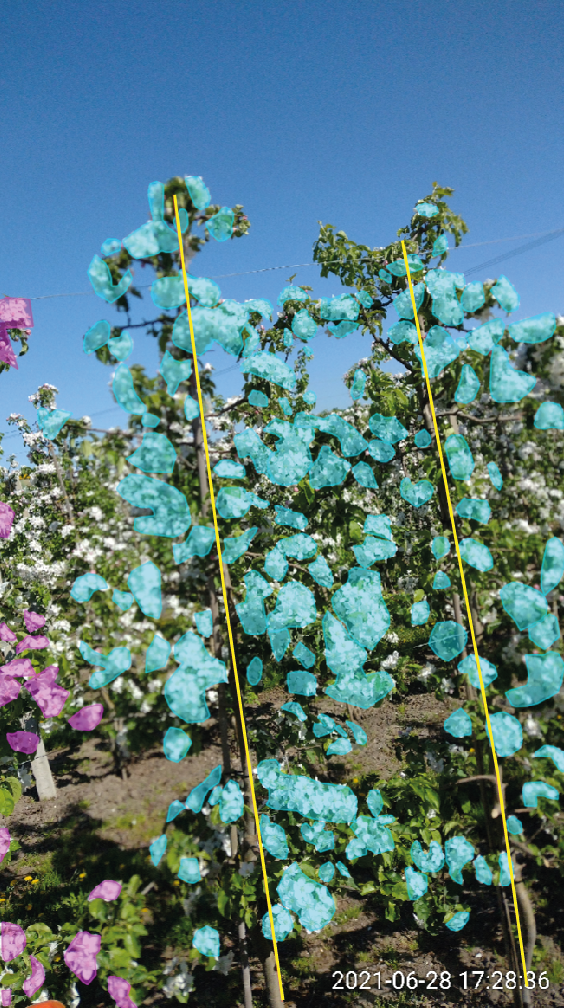
An example of picture annotation. Flower clusters (blue and purple) and tree trunks (yellow) were tagged.
Result 1: Number of flower clusters in the row
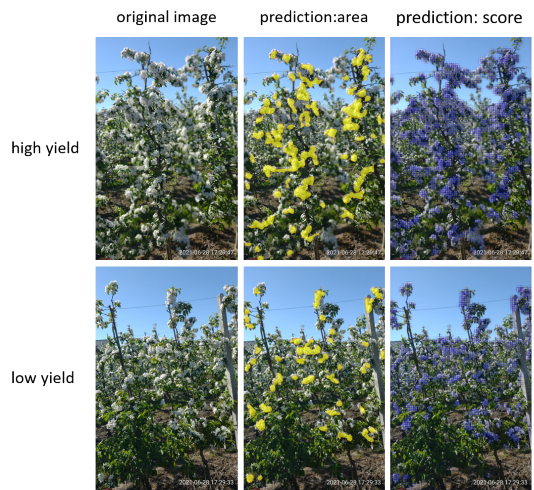
Based on the predicted score, we estimated the apple yield in the orchard. The score suggests the percentage of the area covered with flower clusters in the photo. Further, the score can be converted into the number of predicted apples. This functionality can be used for the expected apple yield calculation in one row or the whole orchard.
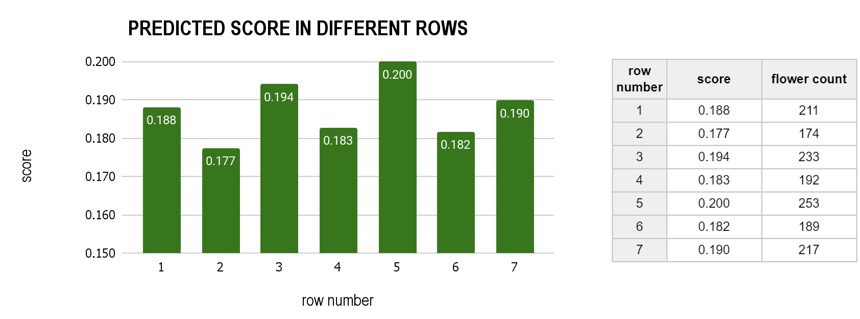
scores predicted by the model for 7 different rows and the flower count for those rows. The score is a mean from all the photos in one row. Rows 2, 5, and 6 have lower yields than others.Result 2: Poor yield sites localization
Each photo contains GPS data. Using these data, we created a map showing the localization of different scores in the orchards. The map contains points with different colors indicating different scores. Thus, these maps are useful for localizing sites with significantly low or high yields. Consequently, this can help the farmer in planning the harvesting properly.
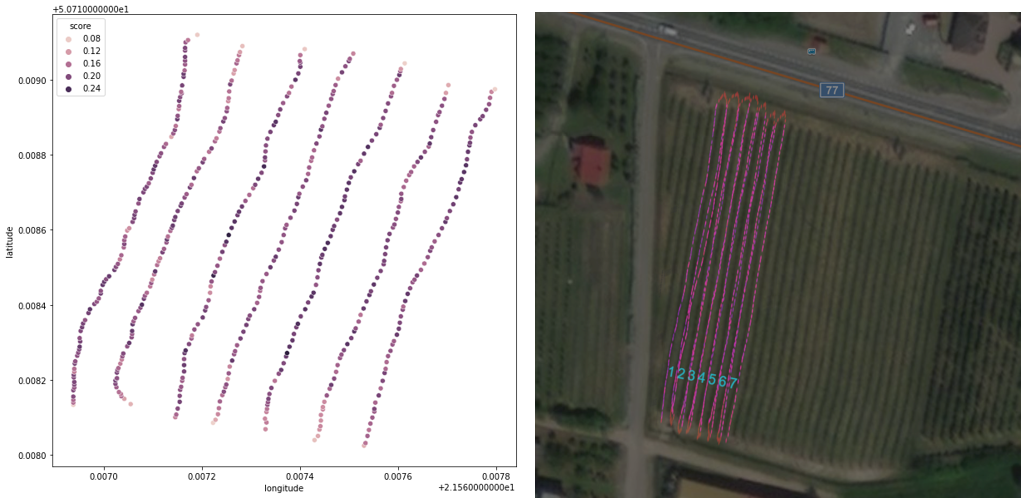
score in seven rows in the orchard. Each dot suggests a score of the picture taken in that location.Challanges and further plans
We learned.
During this project, we encountered a few challenges that helped us learn. Further, we broadened our know-how and fieldwork experiences.
The challenges we tackled and things we have learned included:
- Optimization of the workflow for fieldwork.
- Photo quality optimization – we tried to find the best setting for the mobile phone camera to be able to take pictures in motion.
- Training the model to recognize only the clusters in one row directly in front of the camera – careful and precise annotations helped us achieve this.
- Finding balance: developing accessible technology with proper functionality.
The yield estimation will be confirmed with the actual apple yield in Autumn 2022.
The things we’ve learned helped us prepare for the next projects. If you feel inspired to work with us on a similar project, contact us at: business@plant.id.
Would you like to join our team? We are hiring for senior Python developer ( language only).