A perfect model for plant disease recognition can’t be created overnight. Since the release of the first version of the model, we have been collecting feedback from our clients and working on improvements, new content, and functionalities. Here you can read about our process of improving, testing, and having fun with Plant.id Health Assessment.
March 17th: The Plant.id Health Assessment meets the world
April 2nd: We can identify 100 diseases
June 28th: Multiple images identification improved
August 17th: Is_healthy binary classification improved
October 5th: New data, new architecture, new everything!
In progress: Variegated leaves
Autumn is coming, so are new categories of diseases
The future looks bright indeed
March 17th: The Plant.id Health Assessment meets the world
We released the very first version containing just 8 classes of diseases. These were quite general – such as abiotic, bacterial, etc. Later, we added more classes, but these 8 pioneers gave us an idea of how to create a simplified response from Plant.id API.
This version included is_healthy binary classification as well. This feature can recognize whether a plant is healthy or sick. Read our documentation for more technical information.
April 2nd: We can identify 100 diseases
A model with100 diseases was released for the first time. We were ready and excited to hear what our users think about it. We collected feedback to discover the model’s flaws and conducted an end-user survey to have a better idea of what to improve.
June 28th: Multiple images identification improved
After testing different approaches to calculating disease probability from multiple images (such as taking an average or maximum) we came up with the following solution. We decided to use the is_healthy_probability to improve disease prediction from multiple images. This means that if one of the pictures shows a sick plant (is_healthy_probability is low) and the second one shows a picture of a healthy plant (is_healthy_probability is near 1), more importance is given to the disease probability of the sick plant.
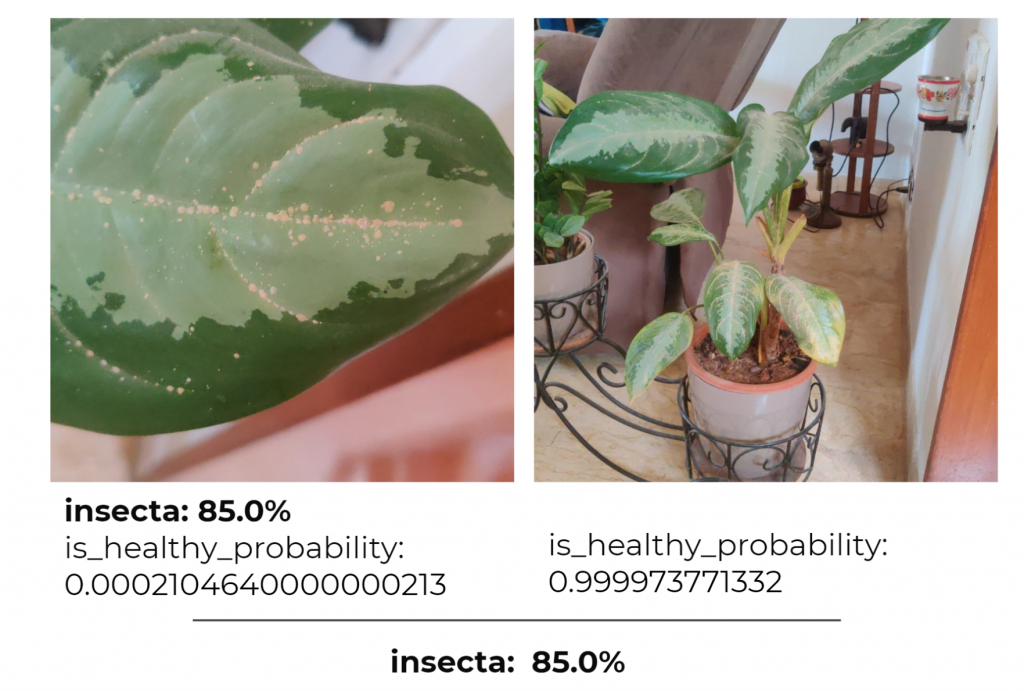
This also means that adding a picture of the whole plant does not negatively affect the identification result. See 5 tips on how to use Plant.id Health Assessment to get more useful pieces of advice.
August 17th: Is_healthy binary classification improved
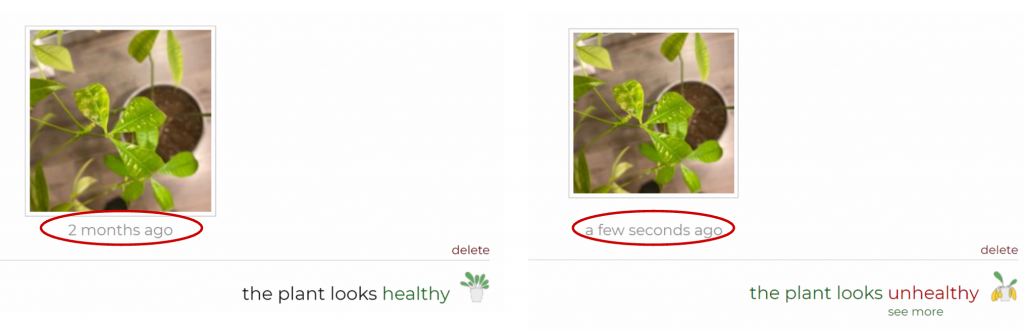
Based on the feedback, we investigated an issue with the incorrect classification of unhealthy plants as healthy. We added new binary annotations (pictures of healthy and unhealthy plants) to train the model. This led to a great improvement in the classification as well as positive reactions by our clients. In the words of ML performance metrics, we saw an increase in recall (leading to recognition of up to 50 % more sick plants) without affecting the precision.
October 5th: New data, new architecture, new everything!
In the most recent version, we added new annotations. There has been a change in the model architecture and values of training parameters.
These changes led to improvements in the performance of the model. Coverage error, an average rank of the correct answer in the response, decreased from 6,7 to 5.2.
In progress: Variegated leaves
Distinguishing pathological changes on leaves (e.g. nutrient deficiencies) from variegation is a bit tricky. We tried adding more binary annotations, which didn’t help much. The problem seems to be lying deep in the image granularity influenced by maximal resolution we can use in the model. We are going to try different approaches, such as image cropping or using larger images, and are curious to see where it leads.
Autumn is coming, so are new categories of diseases
In the beginning, we used only general datasets and annotations from limited sources. As more people use Health Assessments, we can see which diseases are common in their plants and more importantly, which are missing in our categories. During this fall we will analyze which “popular” diseases we are missing and make an effort to add them.
The future looks bright indeed
We have many exciting features on our roadmap. Soon, we are planning to add treatment instructions and other content to the response (such as common names, description, and URL). Further ahead lies symptom recognition, similar images, and the object detection feature.
And we will be improving the model continuously, of course!
Let us know if you have tested the model and have some other issues. Let’s make the magic happen together.